In this tutorial you will get insights on the FinnGen health data supporting the glaucoma endpoint.
It usually takes 20–30 minutes to complete this tutorial, but we know not everyone has time to complete it in one seating. It's ok! This tutorial is designed to make it easy to start now and get back to it later.
Opening Risteys homepage
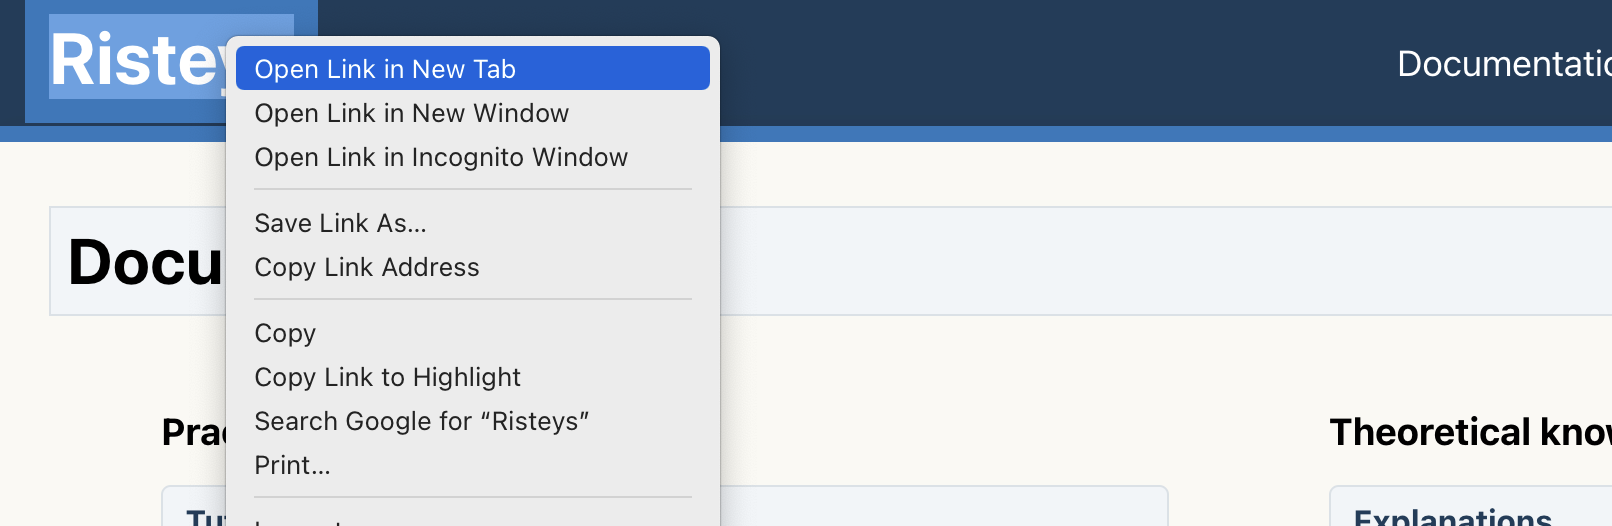
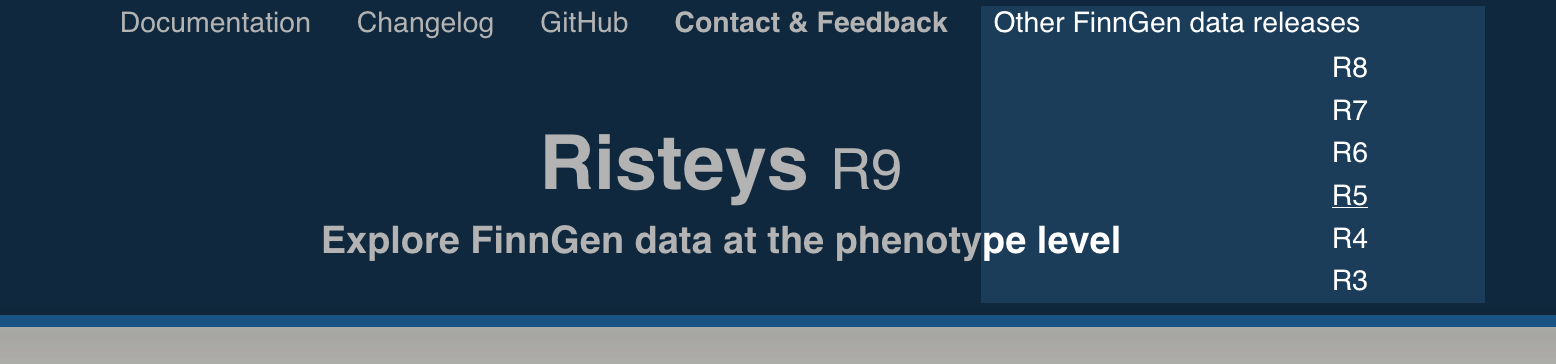
First, open Risteys homepage in a new tab so that we can easily navigate between this tutorial and there.
Go ahead and right-click on the big Risteys title at the top of this page, then select Open Link in New Tab:
You should now be able to quickly go back and forth between this tutorial page and Risteys homepage. Congrats, you are all set up for the next tutorial sections!
Searching for an endpoint
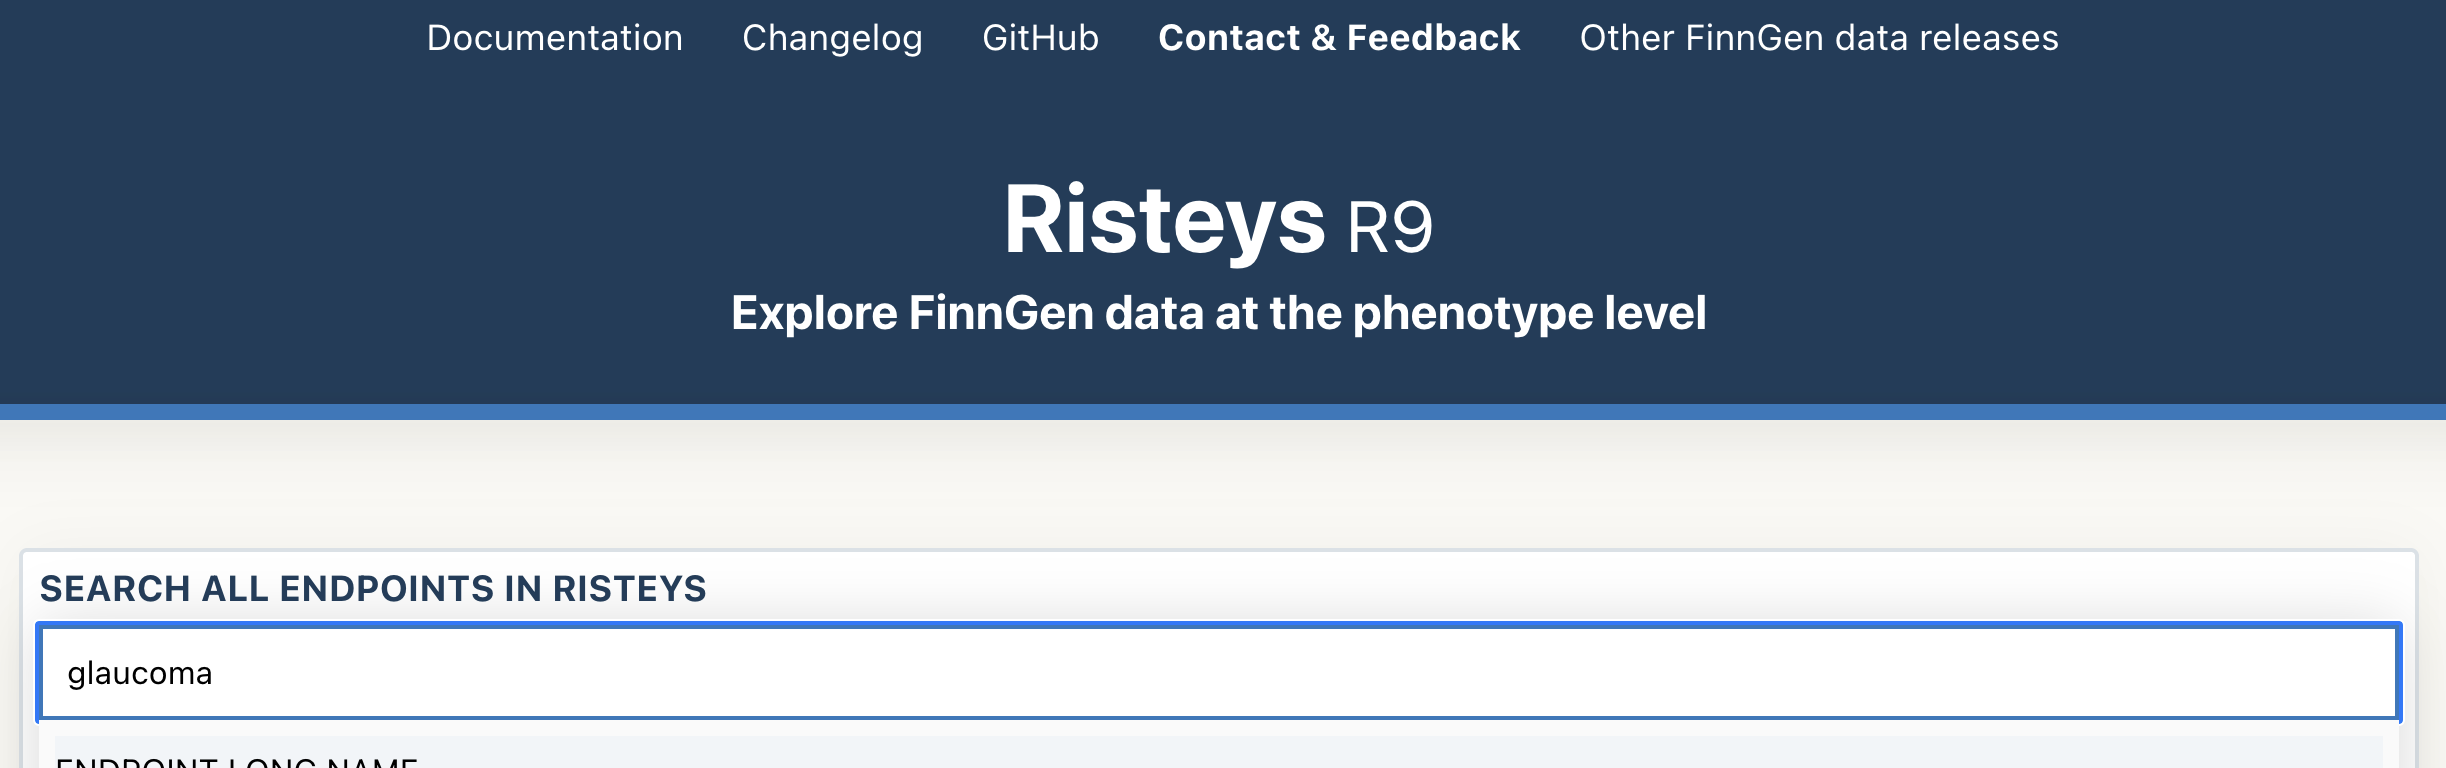
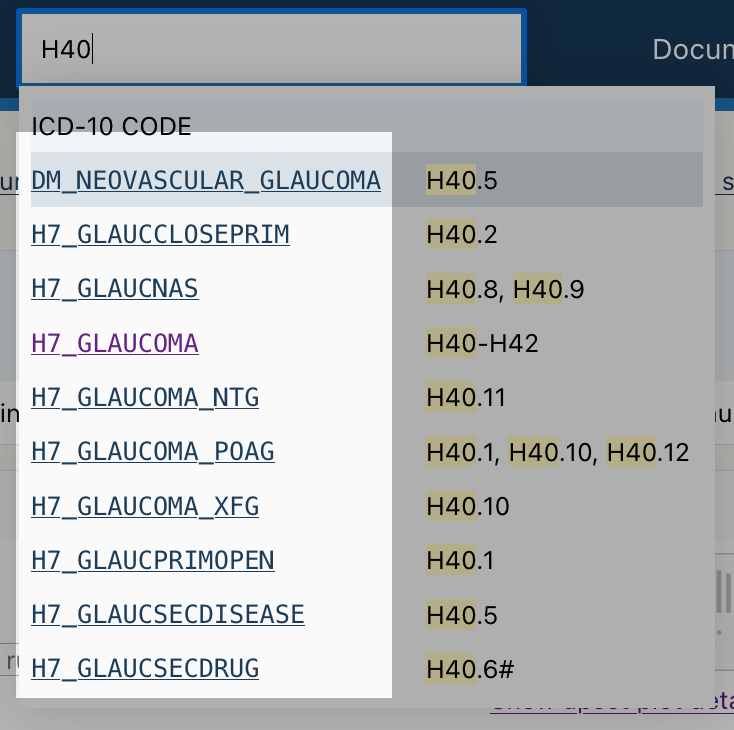
The Risteys homepage has a search bar. Click on it and type glaucoma:
Search results appear has you type, displaying endpoints matching the search query.
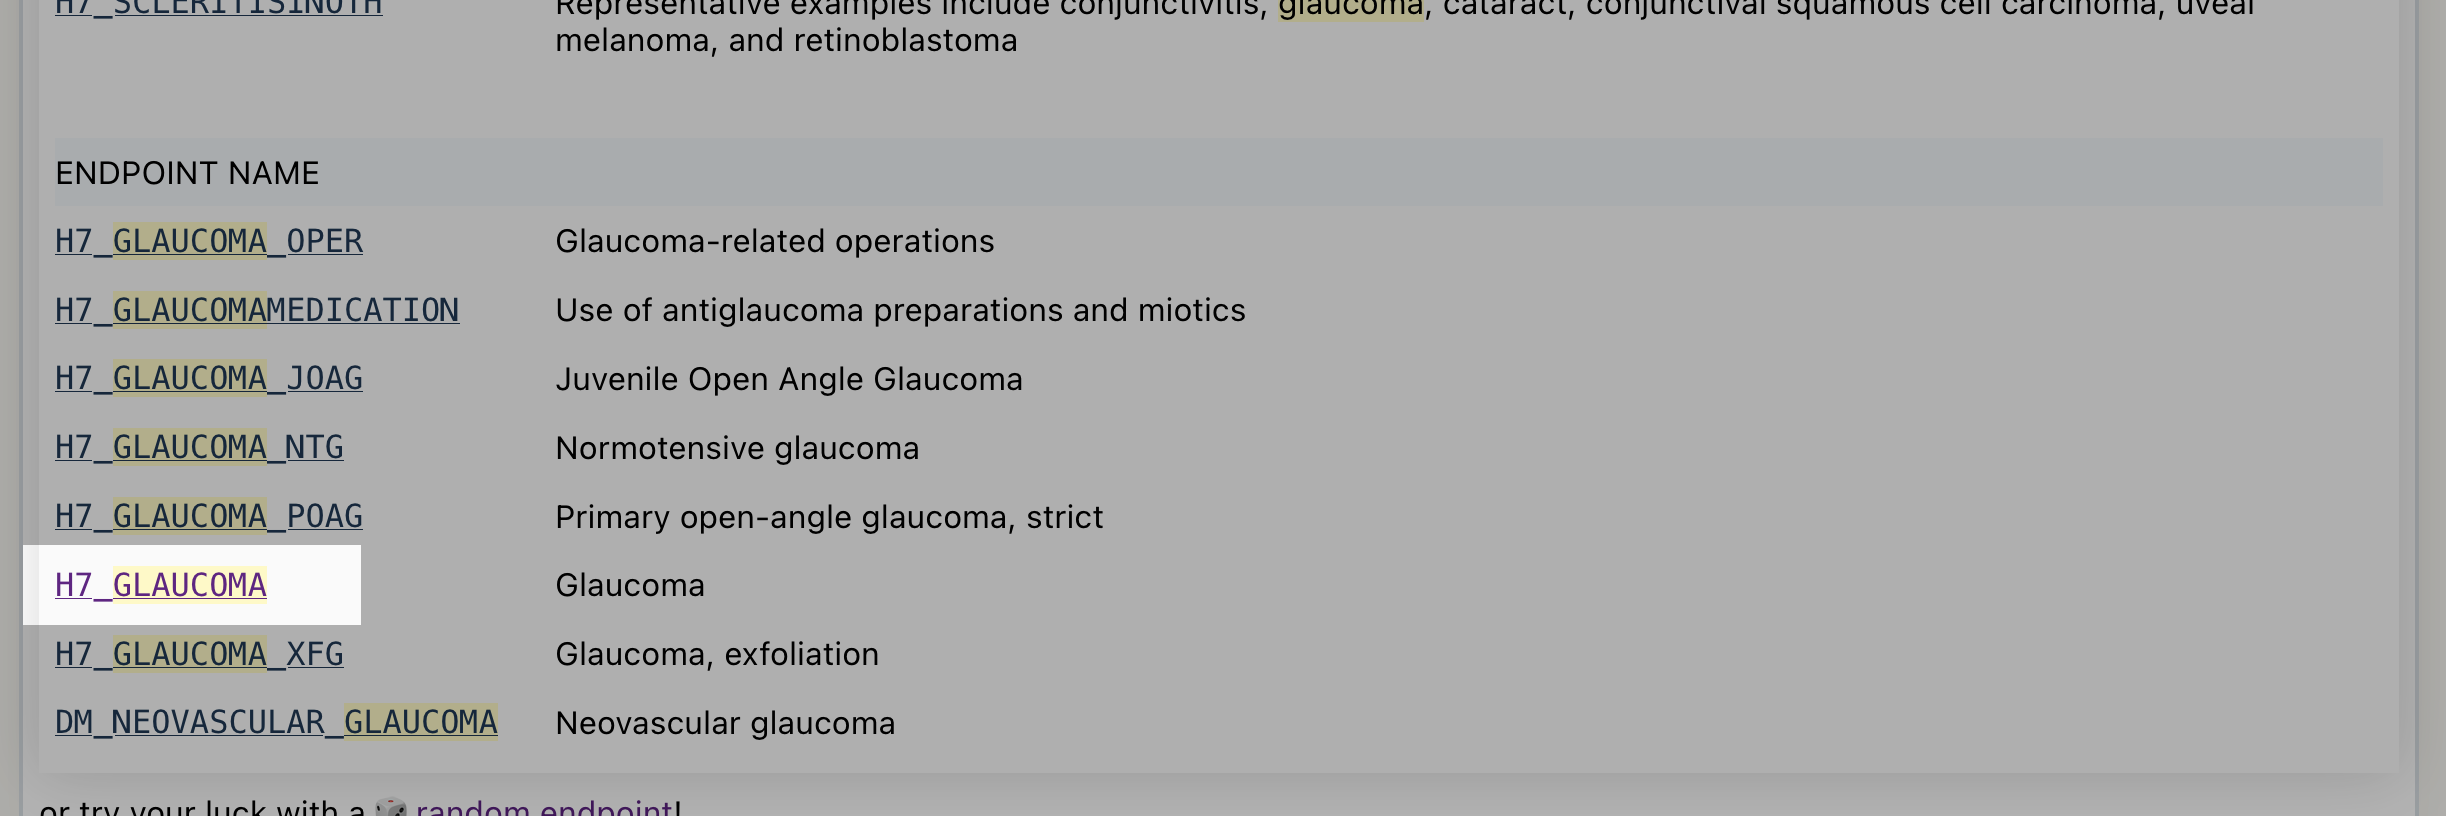
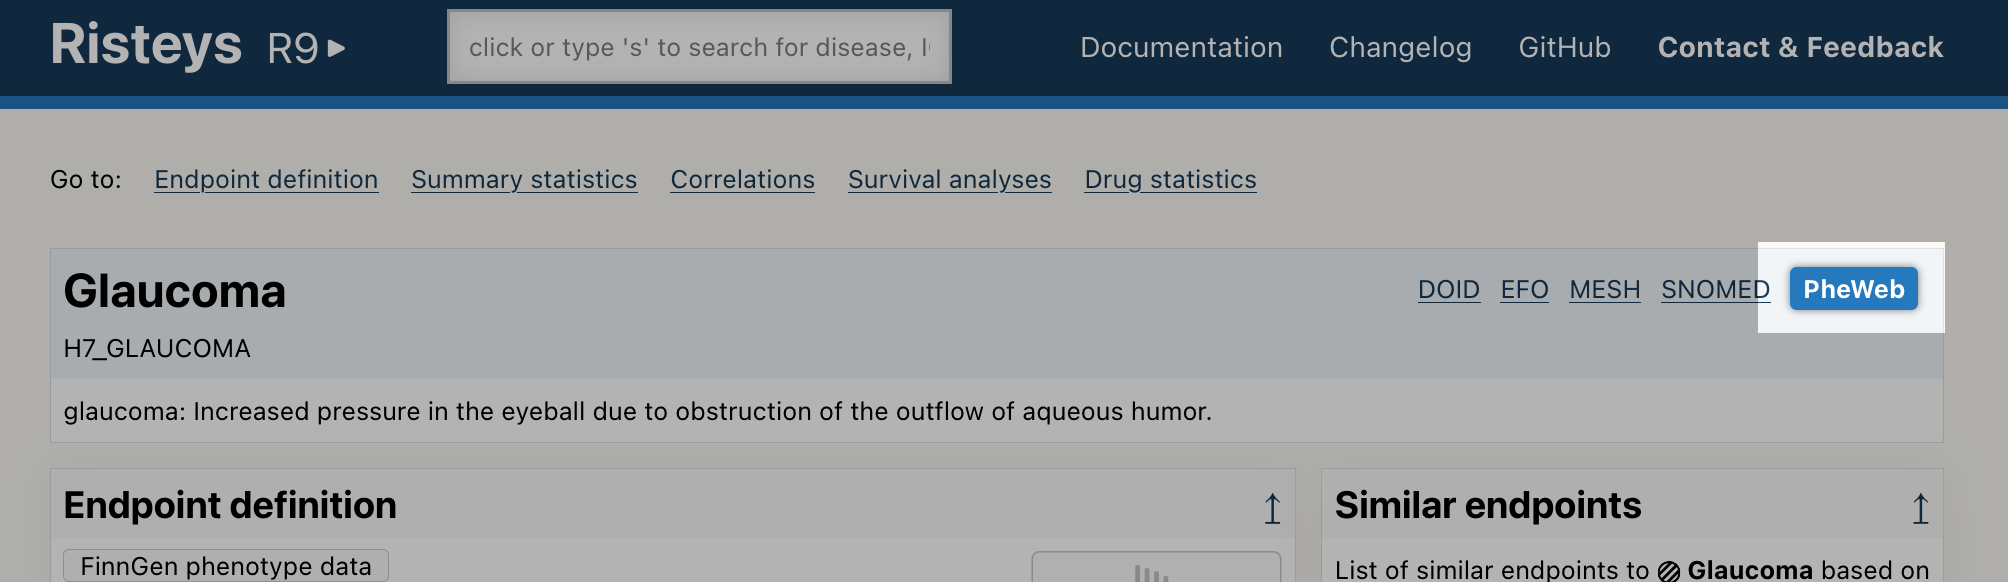
Scroll down the search results to locate the endpoint H7_GLAUCOMA:
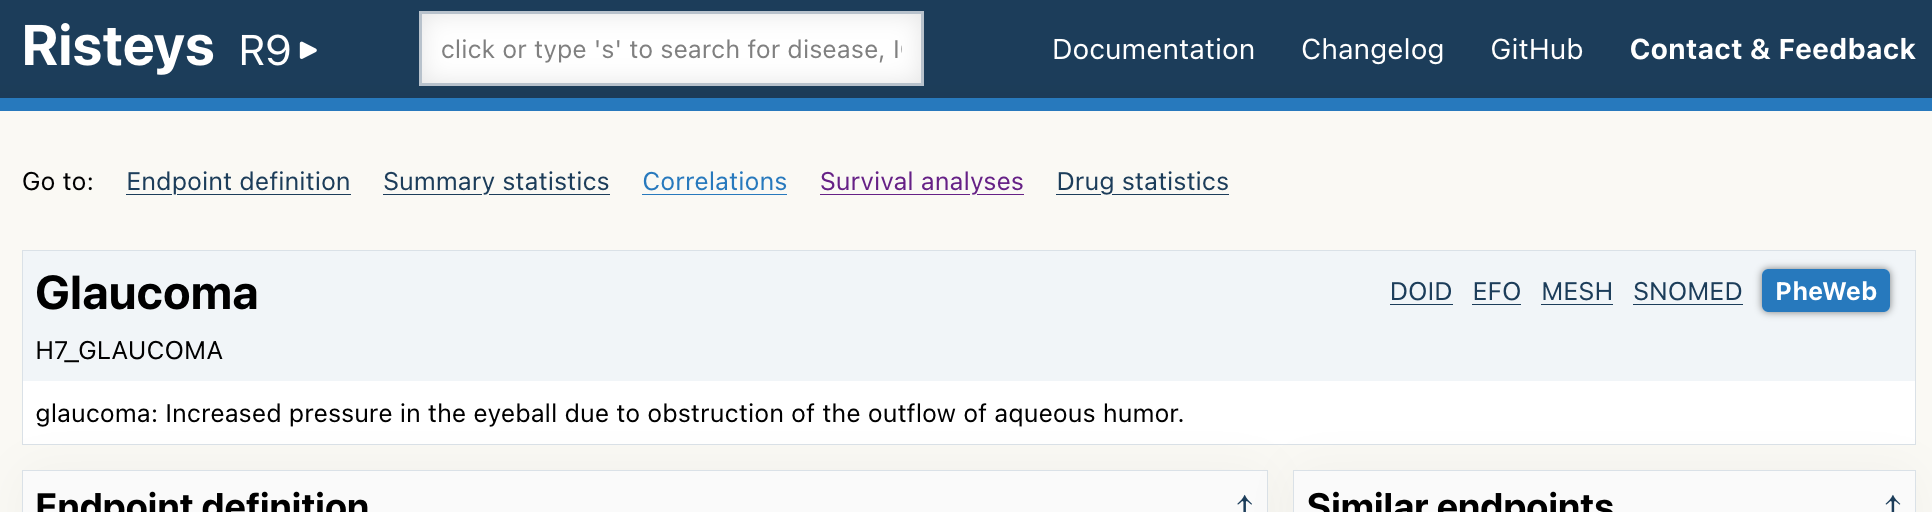
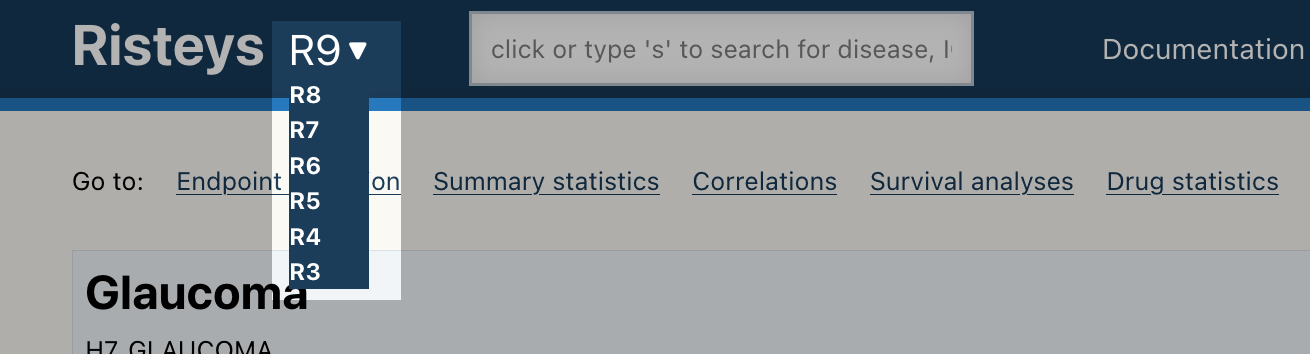
Click on the H7_GLAUCOMA link as shown above. It will take you to its endpoint page, it should look like this:
To make sure you are on the right page, check that you see a title Glaucoma near the top of the page, and the H7_GLAUCOMA code just below it. Like in the screenshot above.
You are now ready for the next section.
Checking how the endpoint is defined
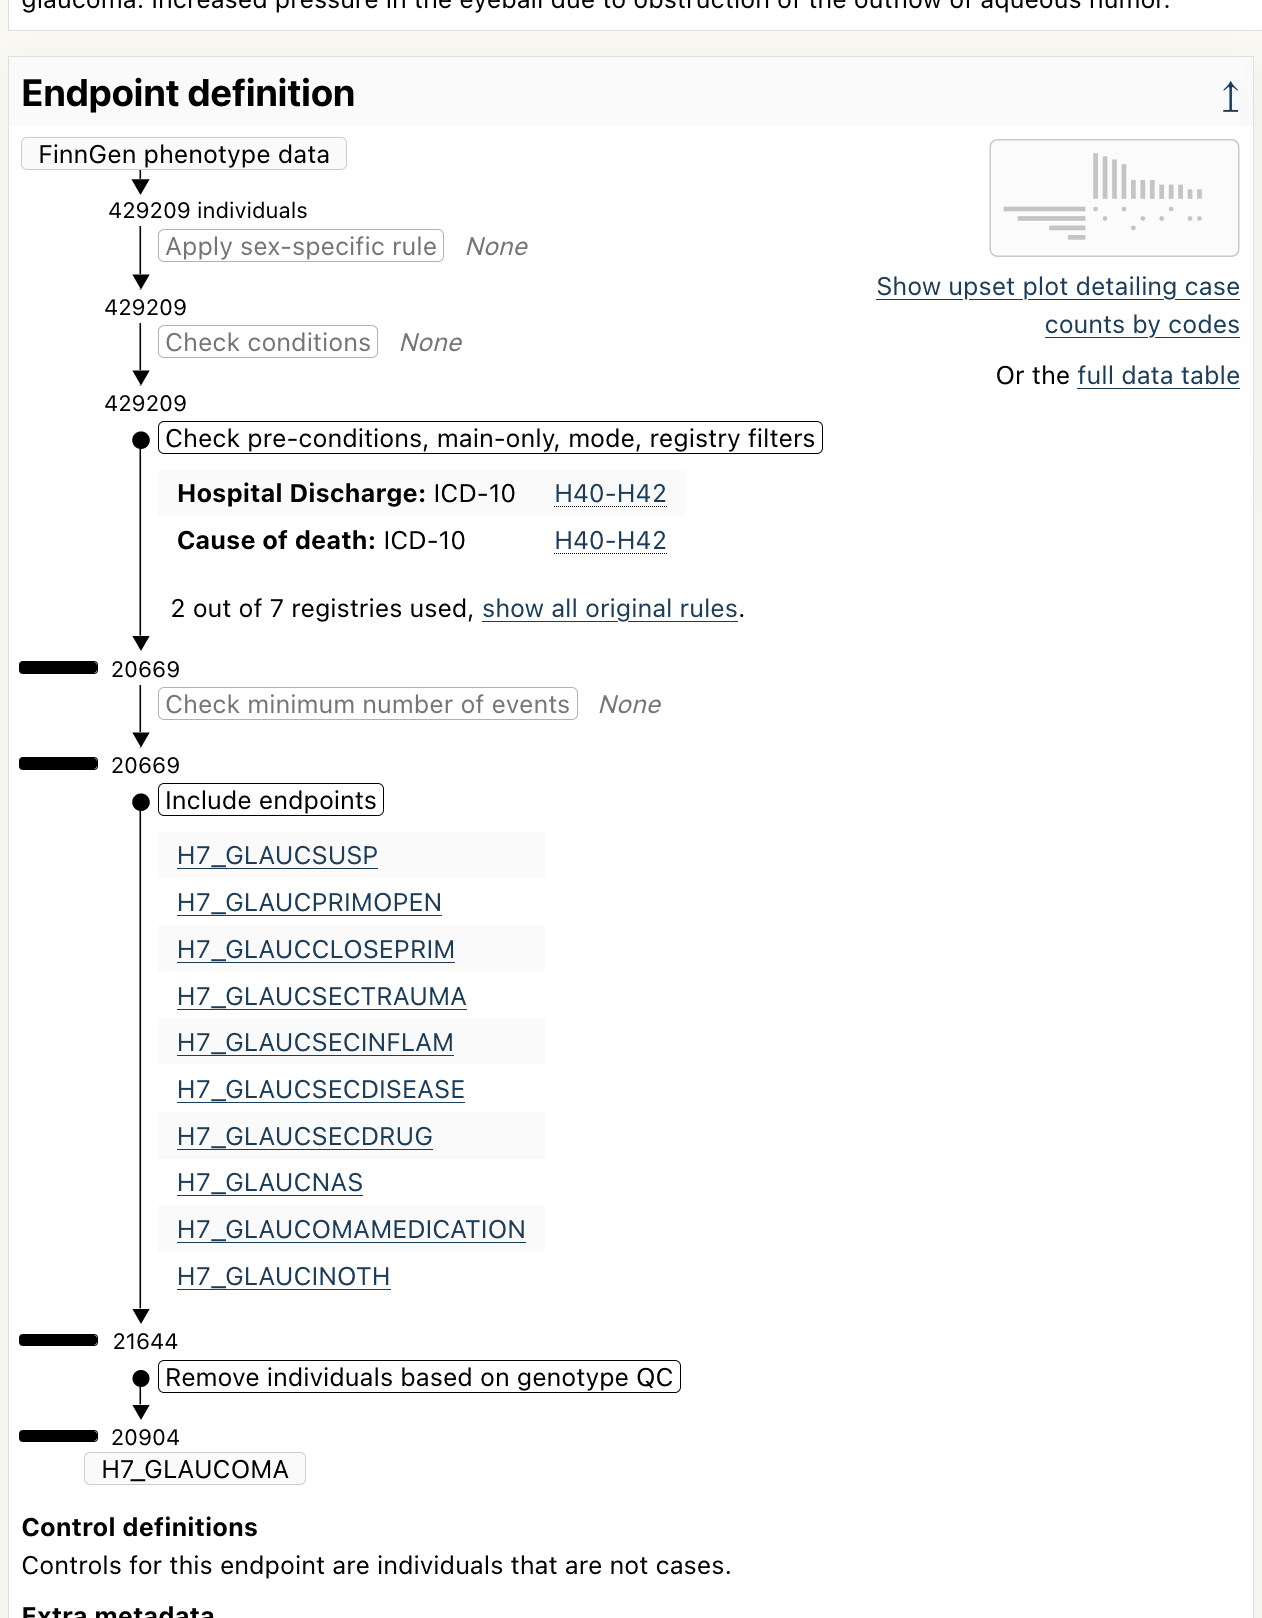
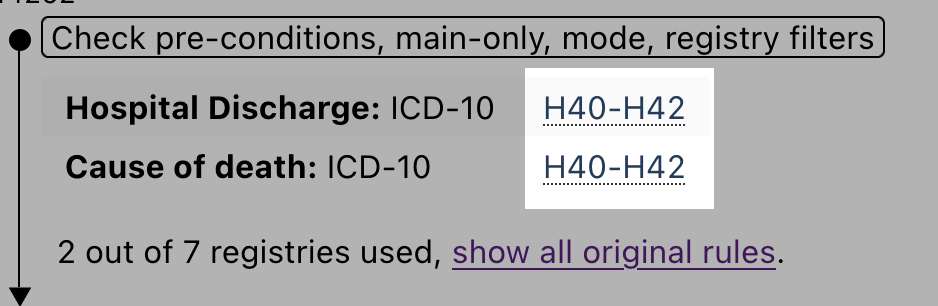
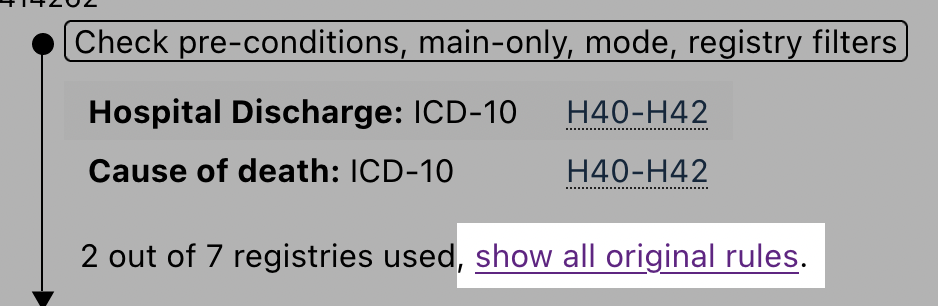
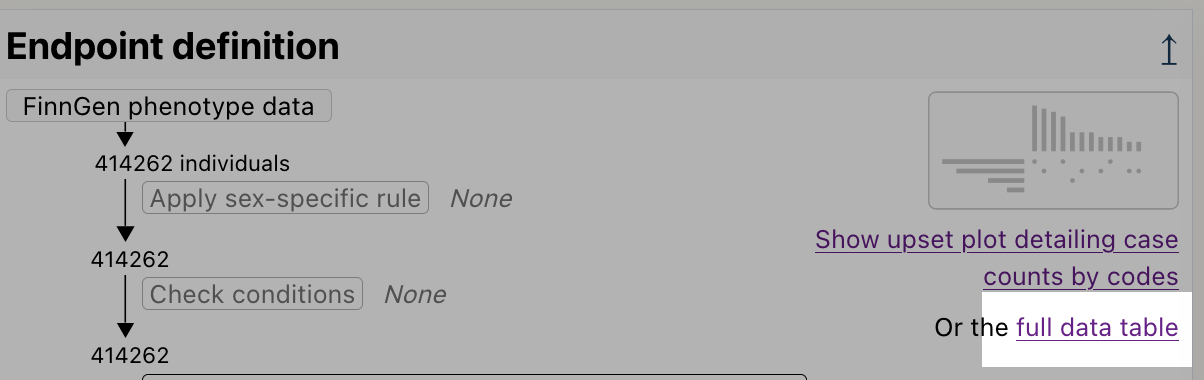
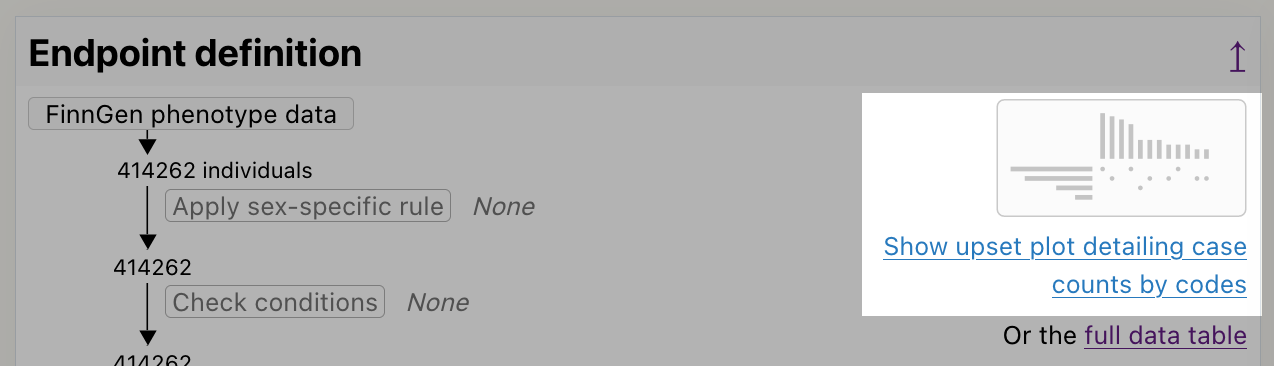
Now that you are on the glaucoma endpoint page, scroll down a bit to reveal the Endpoint definition section:
As we can see, this endpoint is defined using the ICD-10 code H40-H42, and it also include other endpoints.
Checking the upset plot for evidence of code usage
Click on the upset plot icon near the top of the page:
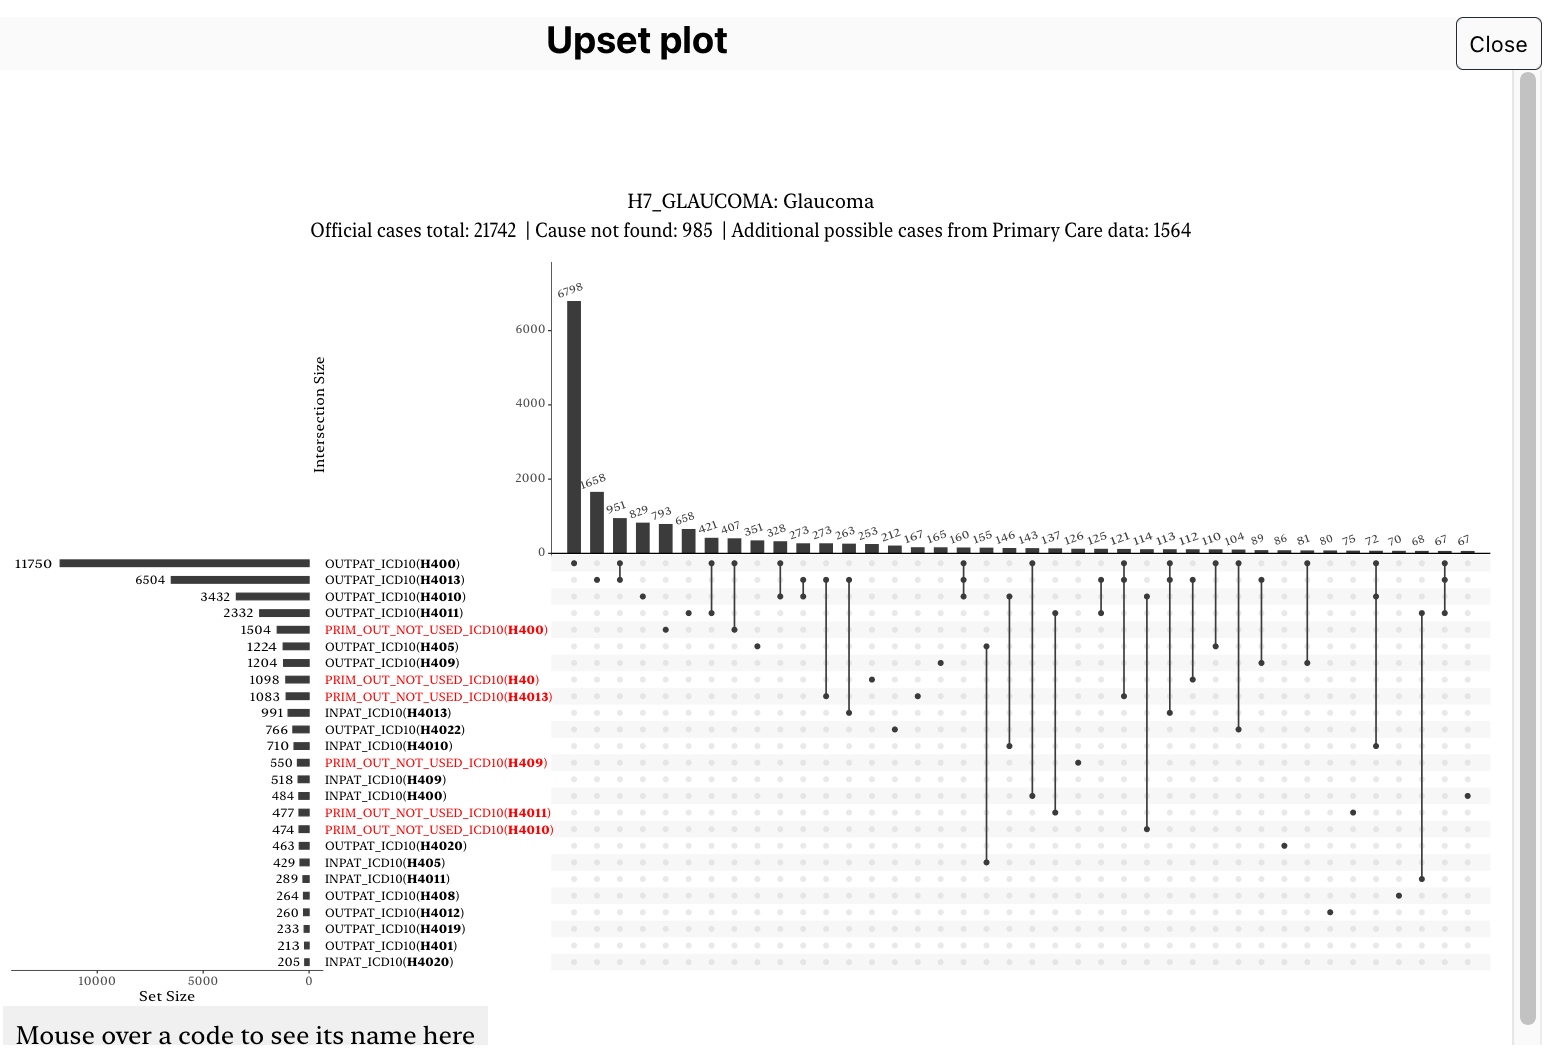
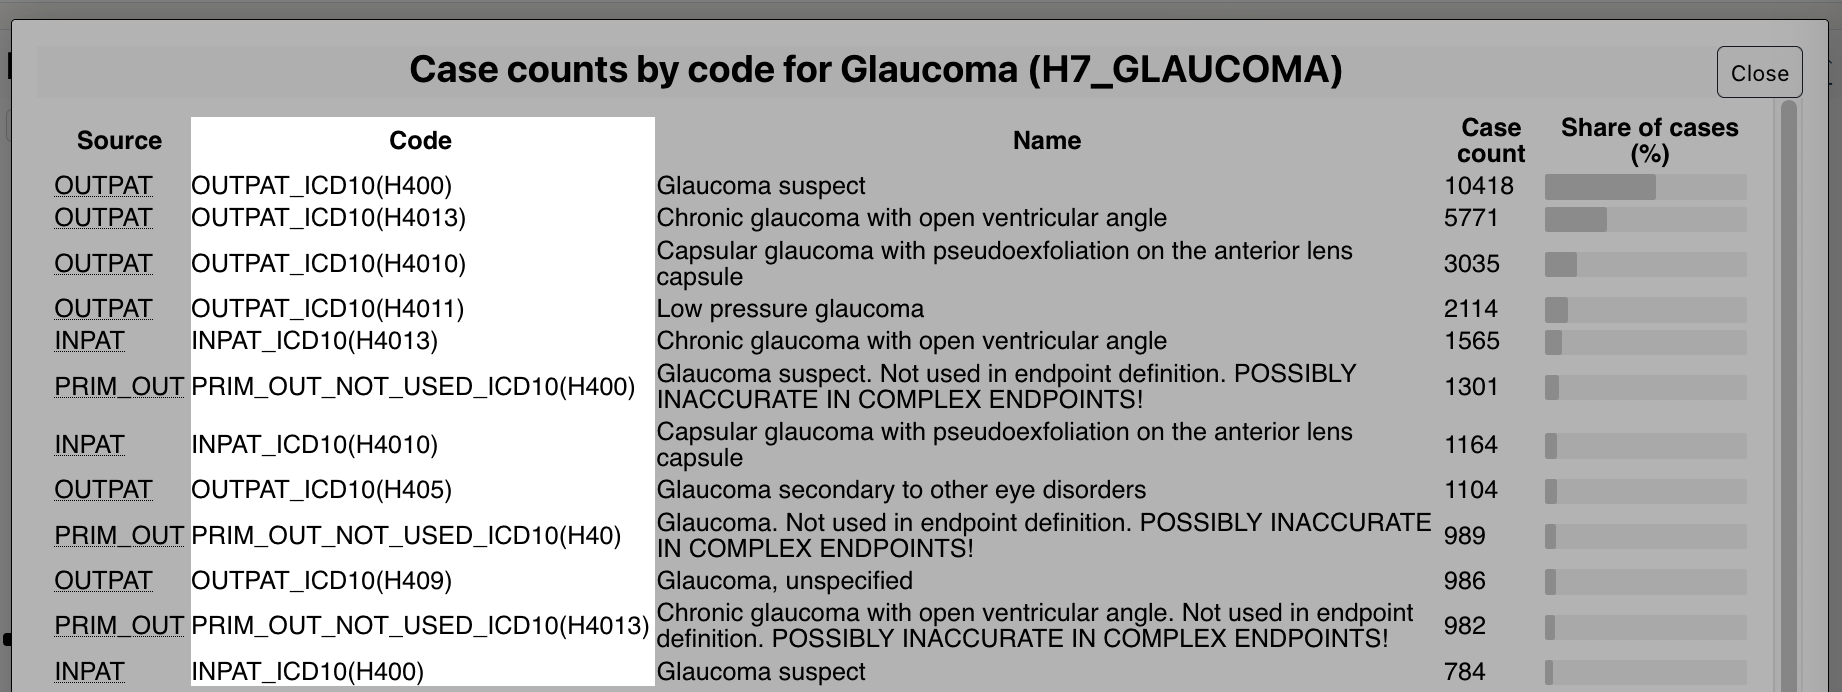
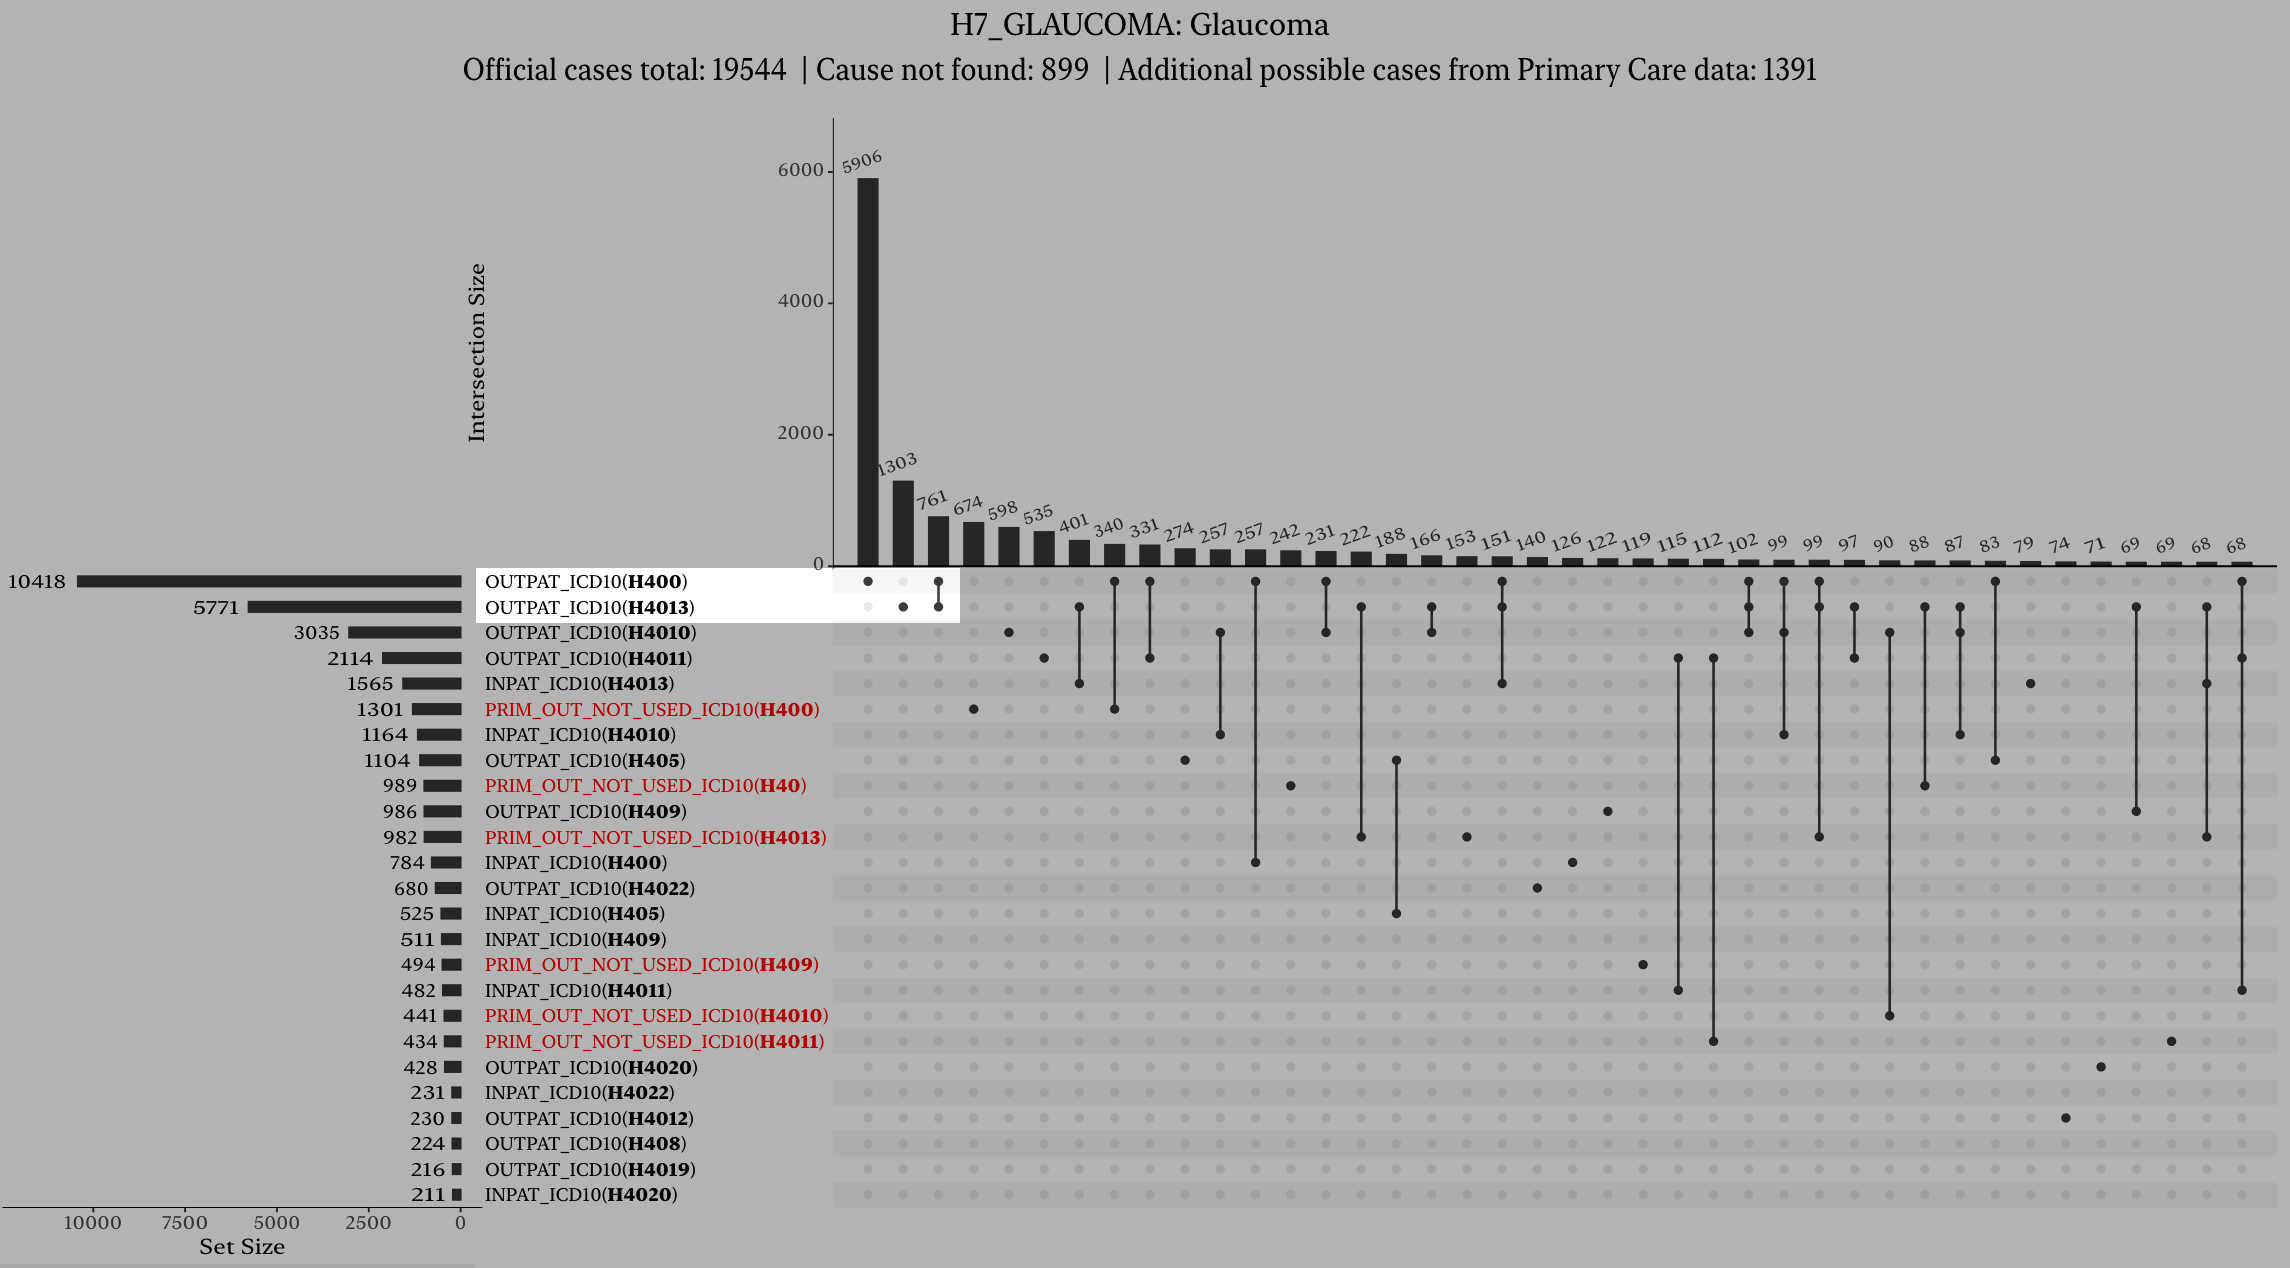
A window pops up with a list of code for that endpoint, and how the cases are distributed among these codes. It should look like this:
You can now close the upset plot by clicking on the Close button the top-right corner:
You are now back on the glaucoma endpoint page. You can continue to the next section.
Checking the summary statistics
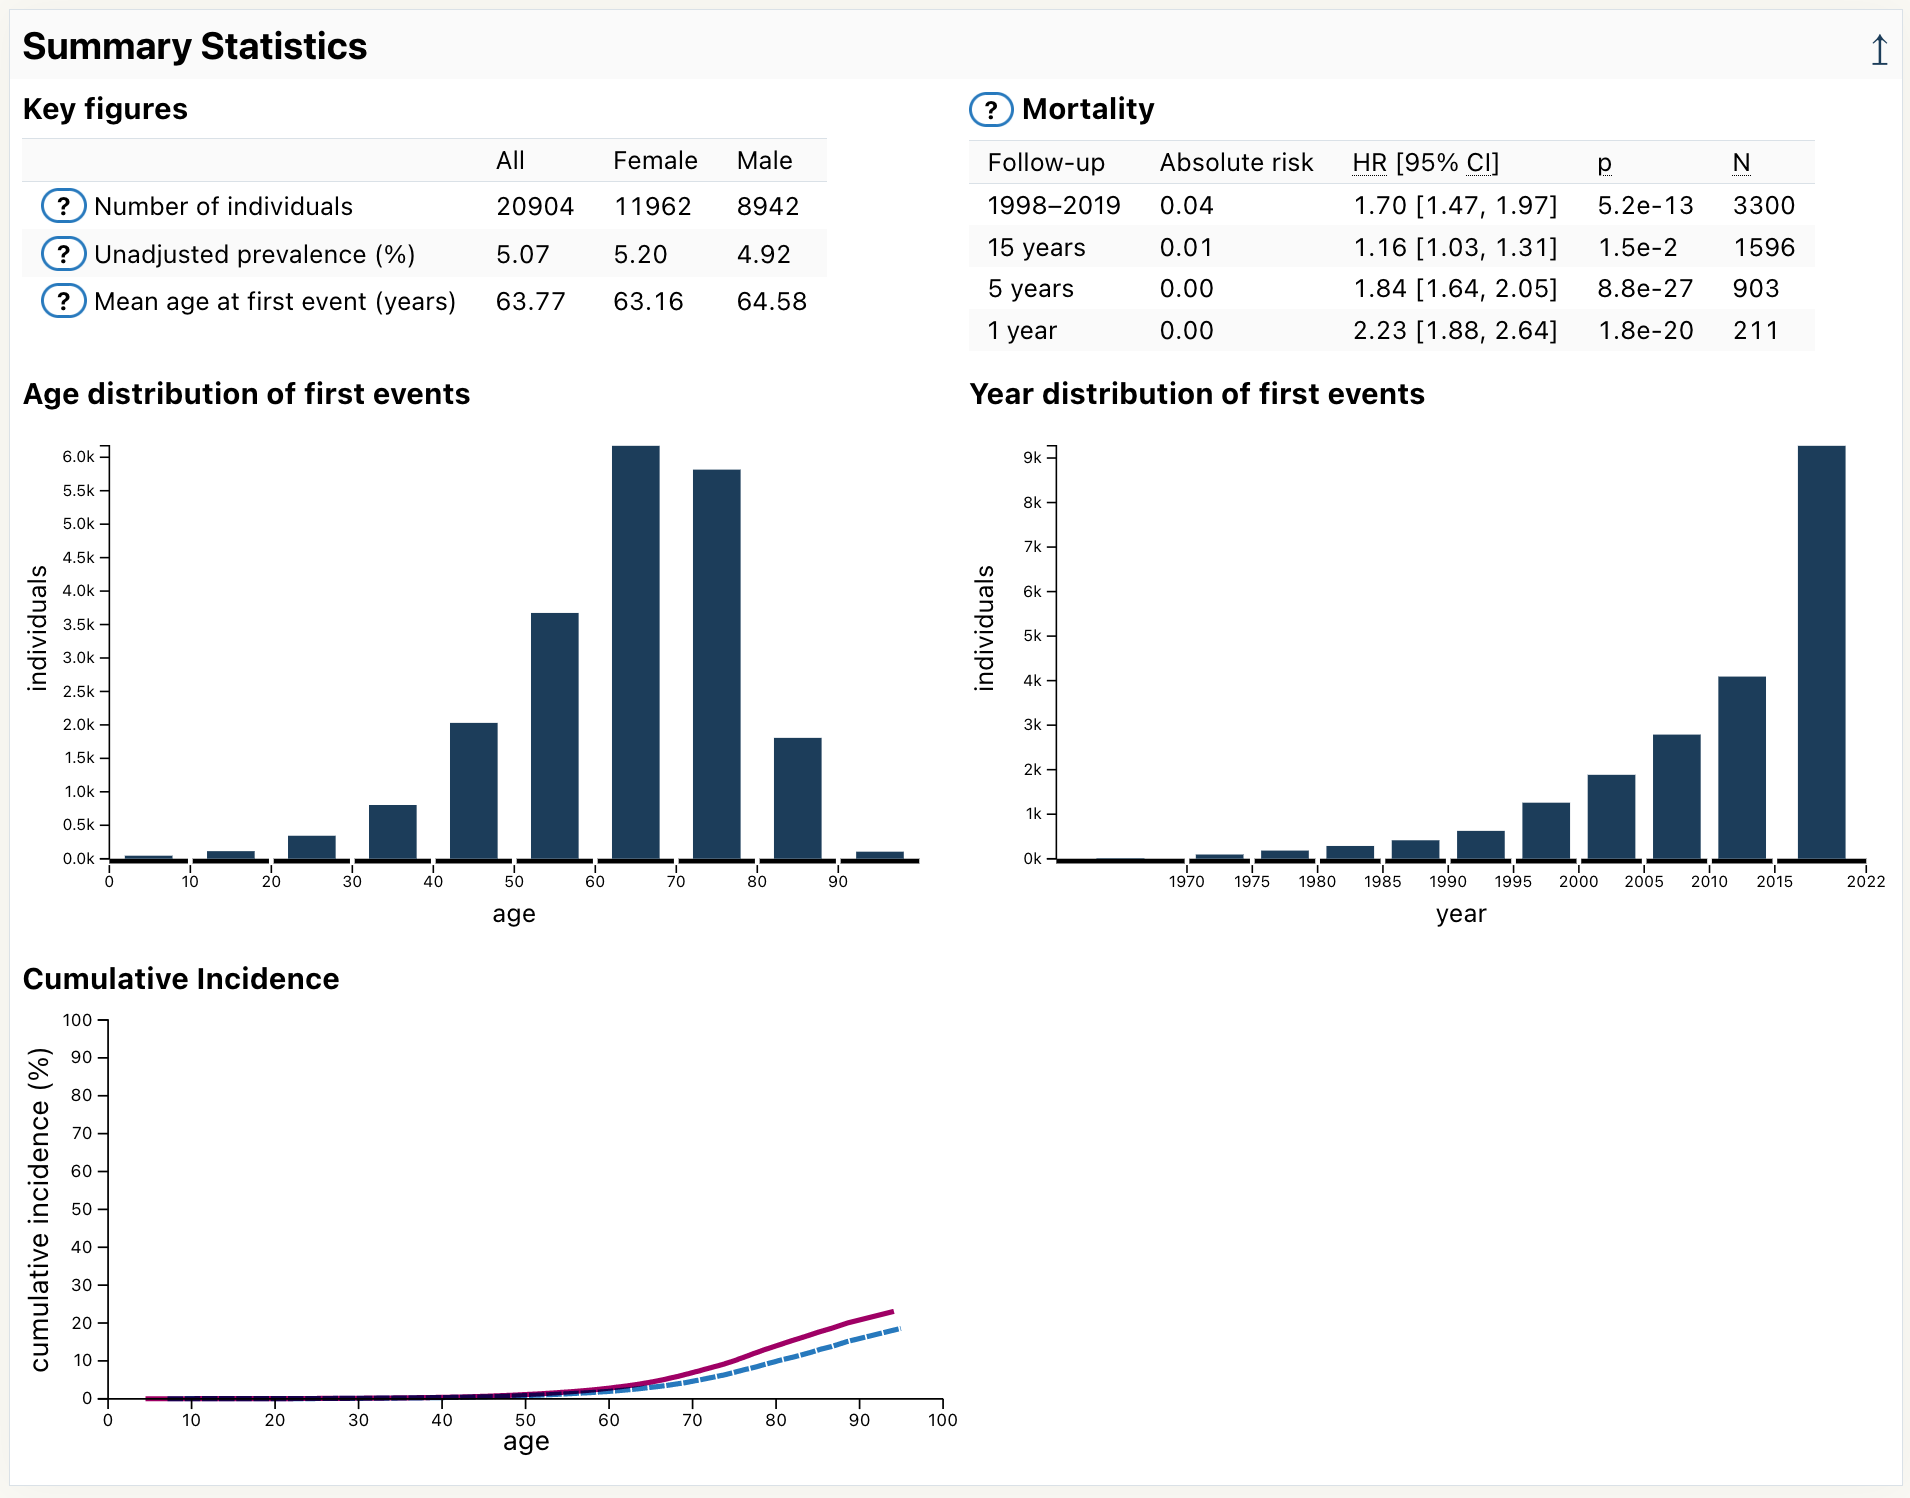
Scroll down the page until you see the section Summary Statistics:
Here you can different statistics for the glaucoma endpoint, such as:
number of cases (20904)
mean age at first event (63.77)
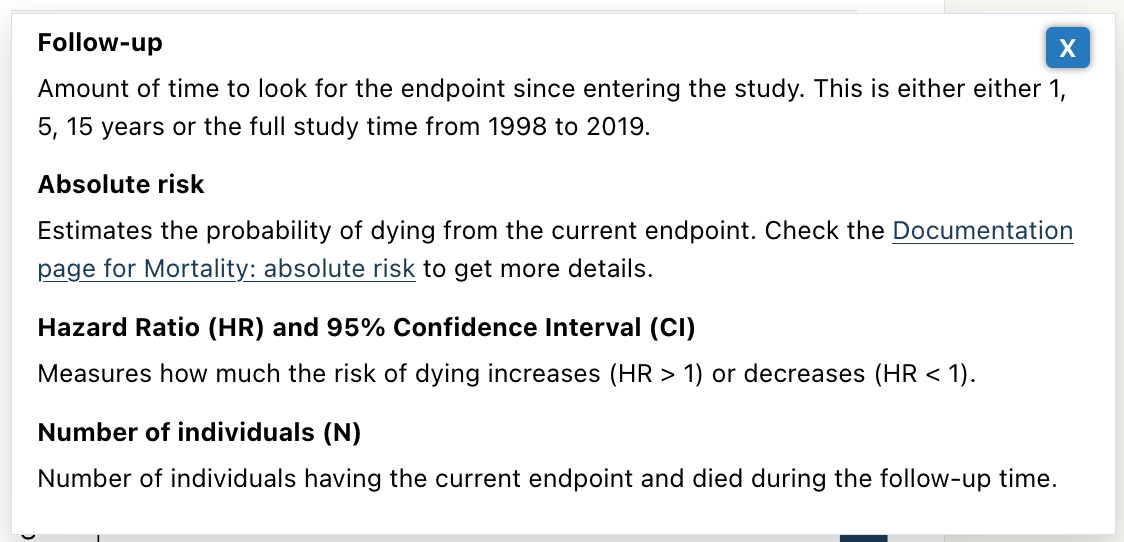
Click on the help icon next to Mortality:
A help panel pops in and provide explanations on how to interpret the mortality table:
Close this help panel by clicking on the X button on the top-right corner:
Notice there are other help buttons on the endpoint page. They explain different concepts and have the same open/close interaction.
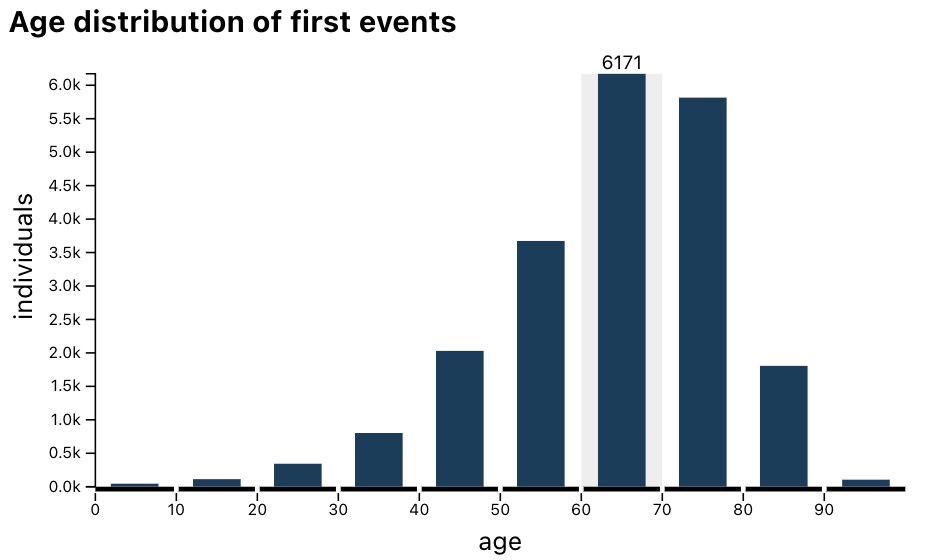
Hover over the 60–70 bin in the age distribution:
The plot now displays there are 6171 cases having a first event of glaucoma when they were between 60 and 70 years old.
The end
Congratulations! You have completed the Risteys tutorial.
You started by searching for the glaucoma endpoint, then checked how it is defined in FinnGen, and finally looked at its descriptive statistics.
Risteys has more to offer: feel free to look at other sections on the glaucoma endpoint page, check other endpoint pages, or browse the documentation below.
Go to the endpoint page of your endpoint of interest.
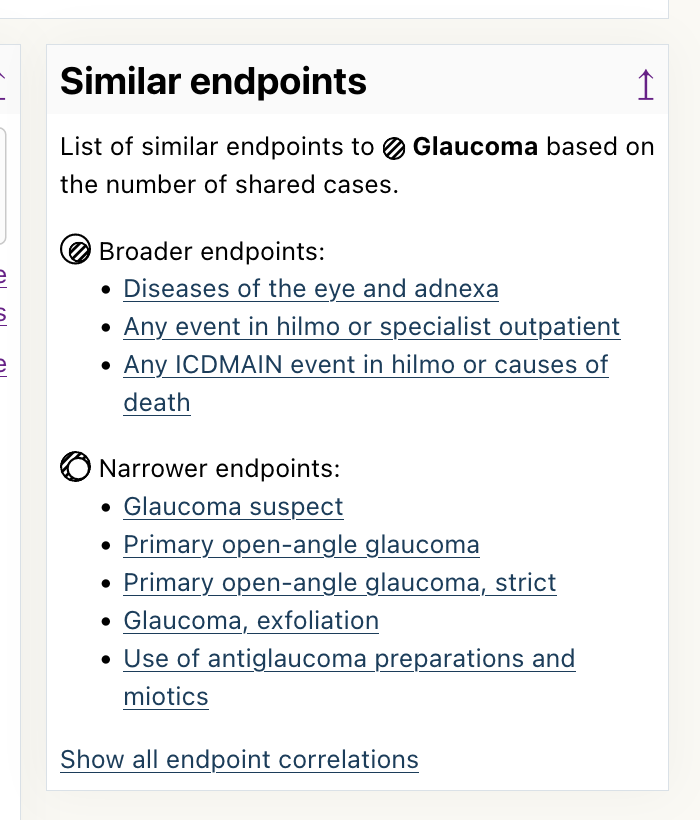
Locate the Similar endpoints box near the top of the page.
Related endpoints which are a strict superset of cases of the current endpoint are shown in Broader endpoints, and endpoints which are a strict subset of cases are shown in Narrower endpoints.
Using the Correlations table
Go to the endpoint page of your endpoint of interest.
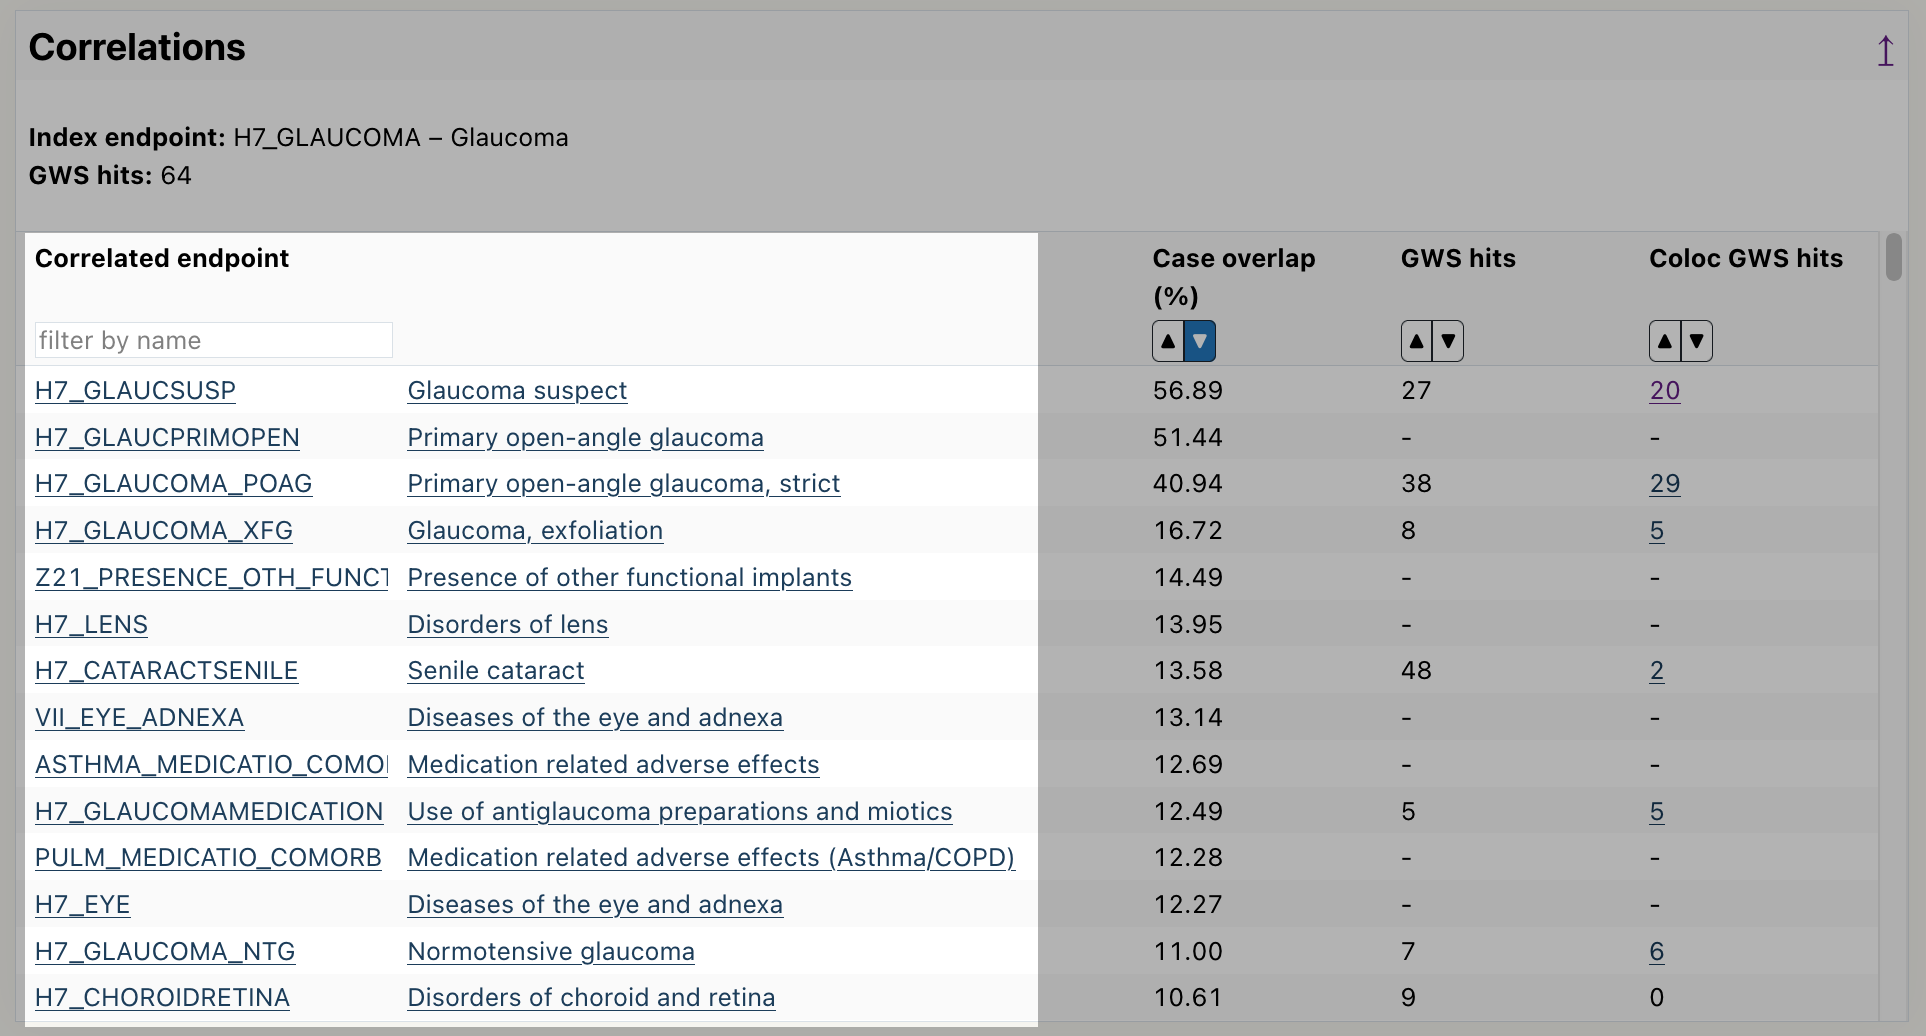
Scroll down to the correlation table.
Read the endpoints from the table, by default it is sorted by highest case overlap between endpoints.
How to get more detailed data on an endpoint? (e.g. data for N<5, histograms with narrower bins)
Risteys doesn't provide data where any data point has less than 5 individuals.
FinRegistry is a joint research project of the Finnish Institute of Health and Welfare (THL) and the Data Science and Genetic Epidemiology Lab research group at the Institute for Molecular Medicine Finland (FIMM), University of Helsinki. The project aims to develop new ways to model the complex relationships between health and risk factors. Statistical and machine learning models are developed to understand and predict disease occurrences using high-resolution longitudinal data. FinRegistry utilizes the unique registry system in Finland to combine health data with a wide range of other information from nearly the whole population of Finland. FinRegistry includes all individuals alive and living in Finland on 1st of January 2010 (FinRegistry index persons) as well as the index persons' parents, siblings, children, and spouses.
What is FinnGen?
FinnGen is a large-scale academic/industrial research collaboration launched in Finland in 2017 with the scope to collect and analyze genomic and health data from 500 000 Finnish biobank participants in 2023. The project aims to improve human health through genetic research, and ultimately identify new therapeutic targets and diagnostics for treating numerous diseases. It produces near complete genome variant data from all the 500 000 participants using GWAS genotyping and imputation and utilizes the extensive longitudinal national health register data available on all Finns. The data freeze R10 from September 2022 consists of over 429 000 individuals. The study currently involves Finnish biobanks, University Hospitals and their respective Universities, the Finnish Institute of Health and Welfare (THL), the Finnish Red Cross Blood Service, the Finnish Biobanks - FINBB and thirteen pharmaceutical companies. University of Helsinki is the organization responsible for the study.
Where does the data come from?
The data in Risteys comes from FinnGen and FinRegistry. Different Finnish health registries make up the phenotypic data of FinnGen and FinRegistry, which in turn is used to build Risteys.
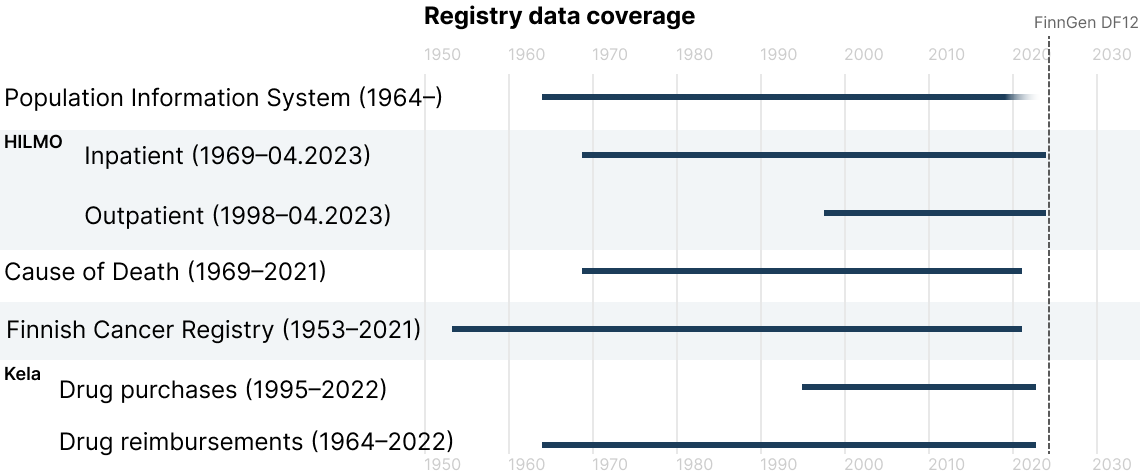
Which years are covered by the different health registries?
The registries used in Risteys vary in their coverage of the data. This image shows which years are covered by each registry in FinnGen at data freeze R12:
What is the difference between ICD-10 and ICD-10-fi?
Many places in FinnGen reference ICD-10 and sometimes ICD-10-fi. Both are similar classifications used in electronic health records, they map codes to health conditions.
ICD-10-fi is a variant of ICD-10 introduced by the Finnish health care system.
The main differences between ICD-10 and ICD-10-fi are:
Some codes are only in ICD-10, while some codes are only in ICD-10-fi. Though most of the codes are shared between ICD-10 and ICD-10-fi.
ICD-10-fi as definitions for combining symptom and cause into a single code. For example: A01.1 Typhoid fever as cause and G01 Meningitis as symptom is the single code A01.1+G01 Meningitis associated with typhoid fever in ICD-10-fi.
ICD-10-fi has a notation to indicate causal medication.
Why is an endpoint defined with ICD-10 but no ICD-9 no ICD-8?
The two main reasons are:
The people that defined the endpoint knew which ICD-10 to pick when creating the endpoint, but they didn't know if any ICD-9 or ICD-8 could also be used.
The people that defined the endpoint know there is no corresponding ICD-9 or 8 that could be used. This is indicated with the symbol $!$.
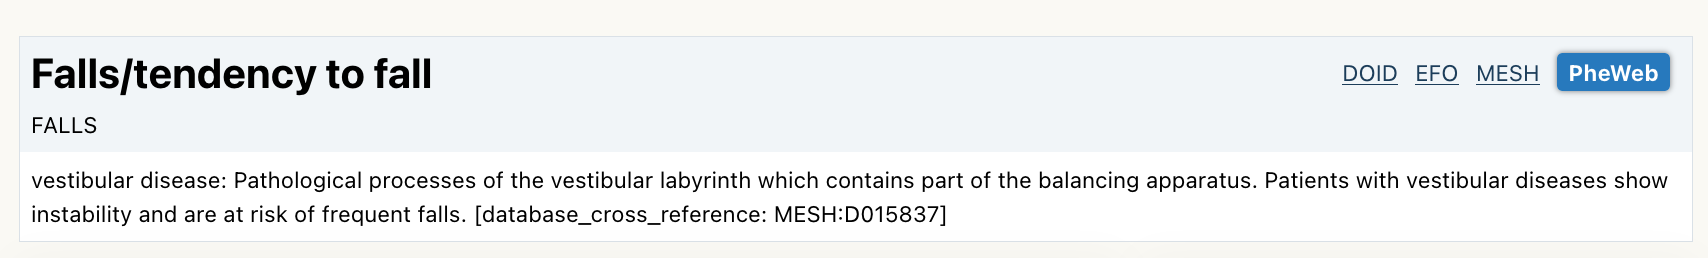
Why are some endpoint descriptions wrong?
In some cases the description shown below the endpoint page will be wrong, like in this example:
This happens because the descriptions are not written as part of FinnGen. Instead they are gathered from various sources, and we try to programmatically attribute the best description to all the FinnGen endpoints. But sometimes our algorithm fails.
Endpoints are linked to international ontologies DOID, MESH, and EFO, and links to the ontologies
are presented on Risteys when available. The mapping is carried out using automated algorithm followed by manual curation.
First, the following hierarchical algorithm is used to link endpoints to DOID and MESH codes:
ICD-10 codes are matched to DOID ICD-10-CM codes
endpoint names are matched to DOID names and synonyms
endpoints are matched to MESH codes and converted to DOID
ICD-10 codes are matched one step up in the ICD-10 hierarchy
endpoint names are matched with DOID codes using the Ratcliff/Obershelp pattern matching (similarity > 0.69)
The resulting DOID and MESH codes are mapped to EFO when a mapping is available.
Next, the fuzzy matching algorithm OnToma
and the ontology annotations for endpoints available on the
Open Targets
portal are used to link endpoints to EFO codes.
Finally, endpoints with discordant EFO annotations between the existing mappings,
OnToma, and Open Targets are manually checked and corrected.
Key figures & distributions
Key figures and the year and age distributions were computed using data of all persons in FinRegistry and FinnGen. Figures are presented separately for FinRegistry index persons, the whole population in FinRegistry, and FinnGen.
The key figures include the following statistics:
Number of individuals: Number of individuals with the endpoint of interest
Period prevalence: Number of individuals with the endpoint of interest divided by the total number of individuals in the cohort
Median age at first event: Median age at the first occurrence of the endpoint
Distributions are presented by age and year at the first event. Bars in distributions are aggregated to include at least 5 individuals, given the sensitive nature of the data.
Cumulative incidence function (CIF)
The cumulative incidence function (CIF) presents the incidence of an endpoint by age and sex. When death is regarded as a competing event, the interpretation of CIF is the probability of getting the endpoint given it is also possible to die without the endpoint. CIF was estimated using the Aalen-Johansen estimator in a competing risks framework where death was treated as a competing event. The model was stratified by sex, and age was used as a timescale to obtain CIF estimates by age.
The eligibility criteria for CIF are as follows:
born before the end of the follow-up (31.12.2021)
either not dead or died during the follow-up period (1.1.1998 to 31.12.2021)
sex information is available
for cases, the outcome endpoint has to occur during the follow-up period
We sampled all or at most 10 000 cases and 1.5 controls per case among the non-cases. Subjects were weighted by the inverse of the sampling probability to account for the sampling design. We required at least 50 cases and controls during this period for running the analysis. Moreover, CIF is only presented for ages with at least 5 cases due to the sensitive nature of the data.
The Aalen-Johansen estimates were obtained using the Lifelines Python library.
Mortality
The goal of the mortality analysis is to estimate the association between an exposure endpoint and death. The results include estimates for the coefficients as well as absolute mortality risk estimations. A Cox proportional hazards model was used to estimate mortality associated with an endpoint. Age was used as a timescale and birth year was included as a covariate to account for calendar effects. The model was stratified by sex.
The eligibility criteria for mortality analysis as as follows:
born before the end of the follow-up (31.12.2021)
either not dead or died during the follow-up period (1.1.1998 to 31.12.2021)
sex information is available
for the exposed persons, the exposure endpoint has to occur during the follow-up period and no more than 30 days prior to death. Persons exposed less than 30 days before death are considered unexposed.
Exposure-stratified sampling was applied to acquire a sufficient number of persons for the analysis. At least 50 exposed and unexposed cases and controls were required. We sampled all or at most 10 000 cases and 1.5 controls per case among the non-cases. The model was weighted by the inverse of the sampling probability to account for the sampling design.
Mortality risks can be used to estimate the risk of death given exposure. Conditional mortality risks represent the risk of an event by time t given that no event has occurred by the time t0. Conditional mortality risks were computed using the following formula: MR(t | t0) = 1 - S(t) / S(t0) where t0 is age at baseline, t is the target age and S is the survival function. The difference between the baseline age and the current year was used as the birth year.
The Cox proportional hazards model was fitted using the Lifelines Python library.
Relationships – Survival analysis
The goal of an endpoint-to-endpoint survival analysis is to estimate the association between two clinical endpoints,
the prior endpoint and the outcome endpoint. We used a Cox proportional hazards model with age as a timescale to estimate
the hazard ratio between the prior endpoint and the outcome endpoint. Birth year and sex were used as covariates.
The eligibility criteria for the mortality analysis are as follows:
born before the end of the follow-up (31.12.2021)
either not dead or died during the follow-up period (1.1.1998 to 31.12.2021)
sex information is available
for individuals with the prior endpoint, the prior endpoint has to occur during the follow-up period and no more than 180 days prior to the outcome endpoint
We sampled all or at most 10 000 cases, i.e. persons with the outcome endpoint, and 1.5 controls per case among
the non-cases separately for individuals with and without the prior endpoint. For sex-specific endpoints,
controls were sampled of the same sex. The model was weighted by the inverse of the sampling probability to
account for the sampling design, as in the mortality analysis.
The Cox proportional hazards model was fitted using the
Lifelines Python library.